Q1 2024 Update Webinar Replay

Original broadcast details
Date: Thursday, April 11, 2024
Executive Summary
The story of 1Q24 was mostly a continuation of the trends from 2023.
The S&P 500 followed its 26.3% return in 2023 with an additional 10.6% return in 1Q24, the best start to a year since 2019. Also like in 2023, in 1Q24 the S&P 500 return benefited from outsized contributions from a few mega-cap growth stocks.
Our LAM-CS composite outperformed the S&P 500 by +110 bps and the S&P 500 Value by +360 bps.
We outperformed despite not owning any of the mega-cap growth stocks that made outsized contributions to the S&P 500.
International markets also benefited from outsized gains in the largest stocks.
Our International and Global portfolios underperformed their cap-weighted benchmarks due to our underweight of the largest stocks, but they outperformed the equal-weighted versions of those benchmarks.
GIVES’ differentiated approach to value-style impact investing returned 9.3% as the MSCI ACWI Sustainable Impact Index lost 3.2%.
Many richly priced, impact-themed stocks suffered serious declines. We avoided these, given our valuation discipline. Price matters, even in impact investing.
Our portfolios remain attractively valued, even after strong returns.
In the U.S., even after our significant gains in 2023 and 1Q24, our LAM-CS forward P/E ended the quarter at 11.7x, only about half a point above its average since inception. Meanwhile, the S&P 500 forward P/E was 21.2x, 36% above its average over that same period.
The spread between our valuation and that of the S&P 500 remains extremely wide.
The valuation spread of our LAM-CS Composite relative to the S&P 500 was 81% at quarter-end. We continue to expect that this spread will compress and drive substantial outperformance. Based on earnings growth, it appears our portfolio should be valued at a premium to the S&P 500, not a discount.
We have been waiting a few years for the valuation spread to compress.
It can be hard to be patient, but outperforming by a little has been a pretty good way to pass the time, while we wait to outperform by a lot. Perhaps the waiting may be over, given our 39.7% return and 980 bps of outperformance over the last 12 months.
Obvious Valuations for Non-Obvious Impact Stocks
2023 was a challenging year for impact and sustainable investment strategies. The MSCI ACWI Sustainable Impact Index underperformed the MSCI World Index by about 2,000 bps. This poor performance was tied to severe multiple compression in several high valuation stocks with obviously impactful businesses. Since impact can be hard to find, the largest impact funds tend to crowd into the same obviously impactful businesses and therefore suffered similar performance woes as the index. Startlingly, 25 stocks are commonly owned by at least one-third of the 15 largest actively managed “Sustainable” or “Impact” funds, according to eVestment. In Lyrical’s Global Impact Value Equity Strategy (GIVES), we do not own any of those obvious impact stocks and we avoided much of the performance pain suffered in 2023.
There is a lot to like about obviously impactful businesses; not only do they improve the world, they also typically benefit from secular growth. However, overpaying for any business, even an impactful one, should eventually lead to poor returns. We believe prime examples of this are the popular and expensive alternative energy companies, including Enphase and SolarEdge.
The alternative energy companies had attractive fundamentals, but they were expensive. In 2023, these companies had fantastic earnings growth of 28%, handily beating the 15% growth of the electrification suppliers, as you can see on the left side of the chart below. However, the alternative energy companies had an average return of -14%. Their problem was not growth; it was valuation. As investors questioned the long-term pace of renewables adoption, this group of companies saw a de-rating of -34% in 2023, as you can see on the right side. Even after this multiple decline, these stocks still ended the year at a lofty 26x earnings.
Impact companies can be found without splurging on high valuations. Consider electrical suppliers providing the materials needed to support electrification. Electrical suppliers grew earnings by a strong, albeit slower 15%, but they started the year at a lower valuation, which allowed for multiple expansion of 28% during the year and a positive average return of 32%.
Gems Amid the Junk™
The simplest way to summarize our investment approach is that we seek to own the gems amid the junk. It is all about getting more for less. More quality and earnings growth for lower valuations.
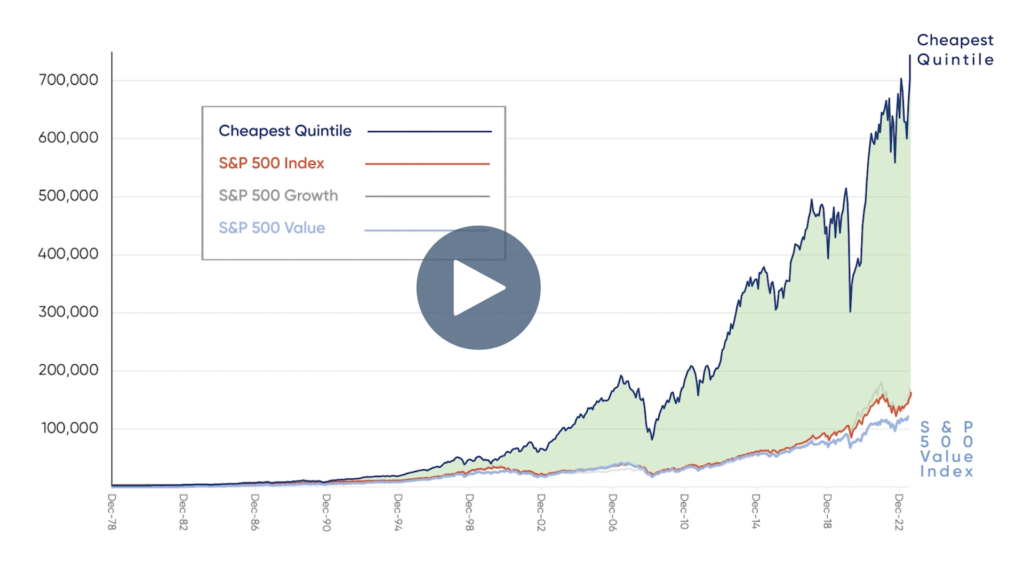
To our core, we are value investors. We seek to own the cheapest stocks in our universe, because the cheapest stocks historically have had the highest returns. Incredibly, in the U.S. the cheapest stocks have outperformed the S&P 500 by nearly 400 bps per annum over the last 40+ years. Over that same period, the cheapest stocks outside the U.S. did even better, and outperformed the MSCI EAFE by over 400 bps per annum.
While cheap stocks have been strong performers, they are often junky companies with low quality characteristics and low earnings growth. Despite these weaker fundamentals, the cheapest stocks still have outperformed over most time periods, and by a wide margin.
This counterintuitive outperformance is driven by the cheap stocks being too cheap. Yes, most of these stocks deserve lower valuation multiples than the rest of the market, but they are so unpopular that their multiples become too low. Over time, these stocks see their multiples expand from “too low” to appropriately low, and that expansion is what has driven their strong performance.
While most of the cheapest stocks are junk, within that junkyard there are gems waiting to be discovered. These gems are companies that have the quality and growth characteristics of pricier stocks, yet their valuations are in line with the cheapest stocks. Undeniably, these gems are rare exceptions that take effort and skill to discover, but they do exist. Given that the cheap junk has outperformed over time, we expect these cheap gems to outperform by even more.
By owning the gems amid the junk, we have built portfolios with the uncommon combination of both deep value and quality growth characteristics. This combination is quantifiable and demonstrates our investment proposition relative to our peers. Compared to most of our peer group, especially those that closely track the value benchmarks, our portfolio not only has a lower P/E valuation, but also a superior earnings growth profile.
Finding gems amid the junk. Getting more for less. That is our formula for success.
The Lyrical Challenge

Lyrical’s portfolios look very different from the S&P 500, and even very different compared to our peers. A big reason for that is our uncommon perspective, and one example of that perspective is something we call The Lyrical Challenge.
The Lyrical Challenge is inspired by the old Pepsi Challenge commercials. Starting in 1975, Pepsi began running television ads where they showed ordinary people participating in a blind taste test between two colas: Pepsi and Coke. At Lyrical, we do our own blind test, but of stocks instead of colas, and of earnings records and valuation multiples instead of taste. The results of these blind comparisons can be surprising, as the perception of a stock can be very different from the reality. In this piece, we present one of the more interesting Lyrical Challenges we have encountered.
2023 Global Impact Value Equity Strategy (GIVES) Review
Our Global Value Impact strategy returned 16.4% in 2023, outperforming the MSCI ACWI Sustainable Impact Index by 1,150 bps and the MSCI World Value by 490 bps, and underperforming the MSCI World index by 740 bps.
While it was satisfying to significantly outperform our style benchmarks by so much, it was frustrating to lag the MSCI World, which benefitted from an outsized contribution from the Magnificent Seven U.S. mega-cap growth stocks. As both value and impact investors, we did not own these seven stocks that accounted for about half of the total index return in 2023. If we compare ourselves to the MSCI World excluding these seven stocks, we would have outperformed by 30 bps.
2023 was a tough year for sustainability investors with the MSCI Sustainable Impact index returning only 4.9% or 18.9 percentage points behind the MSCI World index. A slowdown in the forecasted growth of electric vehicles (“EVs”) and renewables penetration caused a sell-off in many stocks aligned with sustainability trends. Many of these stocks traded at high valuation multiples and fell significantly.
We’ve long advocated for a value-disciplined approach to impact investing. 2023 was a proof point for why. The long-term trends toward EVs and renewables promise of significant growth, caused companies obviously aligned with these trends to trade for sky-high multiples. While many of these obvious impact stocks collapsed in 2023, our value stocks held up while delivering positive change including more than 3 million tonnes of portfolio-weighted emissions avoided.
2023 Global Value Review Letter
Our Global strategy returned 21.2% in 2023, outperforming the MSCI World Value Index by 970 bps and underperforming the MSCI World Index by 260 bps.
While it was satisfying to significantly outperform our style benchmark, it was frustrating to underperform the MSCI World considering our companies delivered better earnings growth than the index. Our portfolio earnings grew 6.2% in 2023, compared to only 4.0% for the MSCI World.
The MSCI World benefitted from an outsized contribution from the Magnificent Seven U.S. mega-cap growth stocks, which as value investors we did not own. The Magnificent Seven accounted for 44% of the total index return in 2023. If we compare ourselves to the MSCI World Equal Weight, which still owns the Magnificent Seven, but at a much lower portfolio weight, we outperformed by 450 bps.
The Magnificent Seven also masked how well non-U.S. equities fared relative to U.S. equities. On the surface it looked like a weaker year for non-U.S. stocks. The S&P 500 outperformed the MSCI World by 250 bps, but the primary difference was attributable to the significant positive contribution from the Magnificent Seven stocks. To get a broader measure of how U.S. and non-U.S. stocks performed, the equal weighted version of these two indices is a better metric. Through that lens, the non-U.S. stocks fared much better, with the MSCI World Equal Weight outperforming the S&P 500 Equal Weight by 280 bps.
2023 International Review Letter
Our International Value Equity strategy returned 13.8% in 2023, underperforming the EAFE and EAFE Value in a calendar year for the first time in our history. It was a frustrating year considering our underperformance was driven by multiple compression and market-cap factors, not fundamentals. In fact, as detailed below, our companies generated better earnings results this year than the indices.
Our approach to focusing on value stocks with strong earnings growth leaves us looking very different than our benchmark, with about a 98% active share. By owning cheap companies with attractive growth, we expect to deliver above-market returns over time. Over short periods, however, looking different than the benchmark can hurt performance. This year, for example, most of our underperformance came from our lack of exposure to the largest-cap stocks in Europe.
With more earnings growth and less stock price return in 2023, the relative valuation gap between our stocks and the EAFE widened to levels we’ve rarely seen since inception, with the portfolio now having more than 75% upside to our estimate of intrinsic value. We believe this sets us up for significant outperformance in the future.
2023 U.S. Value Review Letter
Q4 2023 Update Webinar Replay

Original broadcast details
Date: Thursday, January 11, 2024
Executive Summary
2023 was the third year in a row our U.S. Value CS composite outperformed the S&P 500.
We started the year slowly and then experienced seven strong months to finish ahead of the S&P 500, despite not owning any of the Magnificent Seven mega-cap growth stocks.
Watch | Don’t Get Your Value from an Index